Data Descriptions
Suggested Voting Location Data
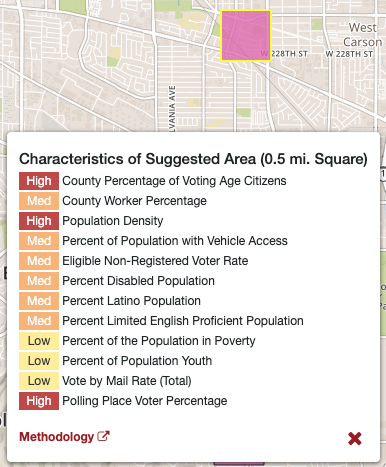
Sites are colored based on their relative rank out of all potential sites within a county and are classified into quantiles. The individual components of the composite score are displayed in the legend as being either High, Med or Low. The High/Med/Low are based on the distribution of scores for each component and ranked using quantile classification.
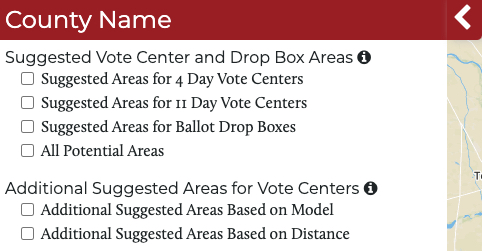
- Suggested Sites: Sites that have been identified as being strategically located to voters. This reflects the minimum number of sites required.
-
Additional Suggested Sites: Sites that are suggested if additional sites over the required minimum are desired. These sites assume the existence of the Suggested Sites.
- Based on Model: Additional 10% of sites that were generated from the Facility Location Model which minimize the total travel cost for all people in the county.
- Based on Distance: Additional sites that were identified based on their potential to decrease travel times for communities that have travel times over ~15 minutes to their nearest site.
- All Suitable Sites: All suitable sites are all sites that had a minimum of population, built environment, roads, etc. where a vote site could potentially be located. These sites can be used to identify nearby sites with similar scores if the suggested site does not contain an actual reasonable voting location.
Points of Interest
- 2020 General Election Precinct Boundaries: 2020 General Election precincts sourced from the Harvard Dataverse Voting and Election Science Team.
- 2022 General Election Precinct Boundaries: 2022 General Election precincts sourced from the Redistricting Data Hub.
- Voting Locations: Voting locations may include several layers, including 2020 General Election and/or 2020 Presidential Primary voting locations. This data is sourced from the Voting Information Project. The presence of a prior voting location should indicate a potentially suitable voting site area.
- Transit Stops: Transit stops indicate the location of transit stops in the county and are sourced from regional GTFS data feeds. Transit stops have been ranked in the model from low to high use based on the frequency of service to the individual stop.
- OpenStreetMap Points of Interest: OpenStreetMap Points of Interest (POIs) are intended to help identify potential voting sites, or highlight that an area has some concentration of activity.
- Non-Government POIs: These include schools, hospitals, kindergartens, community centers, arts centers, colleges, universities, malls, nursing homes, supermarkets, hostels and motels.
- Government POIs: These include post offices, fire stations, libraries, town halls, public buildings, police stations and courthouses.
Voter Data
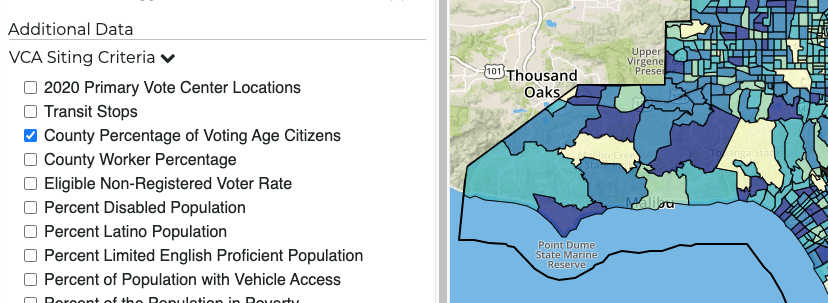
- Percent of County Voting Age Citizens: The number of citizens in this census tract who are voting age divided by the county's total number of voting age citizens.
- Percent of Eligible Voters Not Registered: The percentage of voting age citizens who are not registered to vote.
- Percent of County In-Person Voters: The number of voters who voted at a voting location in this census tract divided by the total number of voters who voted at a voting location in the county.
- 2022 Vote by Mail Rate (Total): The percentage of voters who voted by mail in the 2022 General Election.
- 2022 Vote by Mail Rate (Asian-American): The percentage of Asian-American voters who voted by mail in the 2022 General Election.
- 2022 Vote by Mail Rate (Black): The percentage of Black voters who voted by mail in the 2022 General Election.
- 2022 Vote by Mail Rate (Latino): The percentage of Latino voters who voted by mail in the 2022 General Election.
- 2022 Vote by Mail Rate (Youth): The percentage of voters between the age of 18 and 24 years old who voted by mail in the 2022 General Election.
- 2020 Vote by Mail Rate (Total): The percentage of voters who voted by mail in the 2020 General Election.
- 2020 Vote by Mail Rate (Asian-American): The percentage of Asian-American voters who voted by mail in the 2020 General Election.
- 2020 Vote by Mail Rate (Black): The percentage of Black voters who voted by mail in the 2020 General Election.
- 2020 Vote by Mail Rate (Latino): The percentage of Latino voters who voted by mail in the 2020 General Election.
- 2020 Vote by Mail Rate (Youth): The percentage of voters between the age of 18 and 24 years old who voted by mail in the 2020 General Election.
- 2016 Vote by Mail Rate (Total): The percentage of voters who voted by mail in the 2016 General Election.
- 2016 Vote by Mail Rate (Asian-American): The percentage of Asian-American voters who voted by mail in the 2016 General Election.
- 2016 Vote by Mail Rate (Black): The percentage of Black voters who voted by mail in the 2016 General Election.
- 2016 Vote by Mail Rate (Latino): The percentage of Latino voters who voted by mail in the 2016 General Election.
- 2016 Vote by Mail Rate (Youth): The percentage of voters between the age of 18 and 24 years old who voted by mail in the 2016 General Election.
- 2022 Registered Voter Turnout Rate (Total): The percentage of total registered voters who voted in the 2022 General Election.
- 2022 Registered Voter Turnout Rate (Asian-American): The percentage of total Asian-American registered voters who voted in the 2022 General Election.
- 2022 Registered Voter Turnout Rate (Black): The percentage of total Black registered voters who voted in the 2022 General Election.
- 2022 Registered Voter Turnout Rate (Latino): The percentage of total Latino registered voters who voted in the 2022 General Election.
- 2022 Registered Voter Turnout Rate (Youth): The percentage of total registered voters between the age of 18 and 24 years old who voted in the 2022 General Election.
- 2020 Registered Voter Turnout Rate (Total): The percentage of total registered voters who voted in the 2020 General Election.
- 2020 Registered Voter Turnout Rate (Asian-American): The percentage of total Asian-American registered voters who voted in the 2020 General Election.
- 2020 Registered Voter Turnout Rate (Black): The percentage of total Black registered voters who voted in the 2020 General Election.
- 2020 Registered Voter Turnout Rate (Latino): The percentage of total Latino registered voters who voted in the 2020 General Election.
- 2020 Registered Voter Turnout Rate (Youth): The percentage of total registered voters between the age of 18 and 24 years old who voted in the 2020 General Election.
- 2016 Registered Voter Turnout Rate (Total): The percentage of total registered voters who voted in the 2016 General Election
- 2016 Registered Voter Turnout Rate (Asian-American): The percentage of total Asian-American registered voters who voted in the 2016 General Election.
- 2016 Registered Voter Turnout Rate (Black): The percentage of total Black registered voters who voted in the 2016 General Election.
- 2016 Registered Voter Turnout Rate (Latino): The percentage of total Latino registered voters who voted in the 2016 General Election.
- 2016 Registered Voter Turnout Rate (Youth): The percentage of total registered voters between the age of 18 and 24 years old who voted in the 2016 General Election.
Demographic & Population Data
- Black Percent of Population: Percent of the census tract population that is Black alone, not Hispanic or Latino.
- Asian-American Percent of Population: Percent of the census tract population that is Asian-American alone, not Hispanic or Latino.
- Asian Indian Percent of Population: The percentage of the population that is Asian Indian.
- Chinese Percent of Population: The percentage of the population that is Chinese.
- Filipino Percent of Population: The percentage of the population that is Filipino.
- Japanese Percent of Population: The percentage of the population that is Japanese.
- Korean Percent of Population: The percentage of the population that is Korean.
- Vietnamese Percent of Population: The percentage of the population that is Vietnamese.
- Latino Percent of Population: The percentage of the population that is Hispanic or Latino.
- Mexican Percent of Population: The percentage of the population that is Mexican.
- Puerto Rican Percent of Population: The percentage of the population that is Puerto Rican.
- Cuban Percent of Population: The percentage of the population that is Cuban.
- Dominican Percent of Population: The percentage of the population that is Dominican.
- South American Percent of Population: The percentage of the population that is South American.
- Central American Percent of Population: The percentage of the population that is Central American.
- Native American Percent of Population: The percentage of the population that is Native American.
- White Percent of Population: Percent of the census tract population that is White alone, not Hispanic or Latino.
- Youth Percent of Population: The percentage of the population between the age of 18 and 24 years old.
- Disabilities Percent of Population: The percentage of the population that is disabled.
- Limited English Proficient Percent of Population: The percentage of the population that has limited English proficiency.
- Percent of County Workers: The percent of employed county residents in a census tract out of the total employed county residents in the county.
- Percent of Population with Vehicle Access: The percentage of the population with access to a vehicle.
- Percent of Population in Poverty: The percentage of the population with income below the poverty level.
- Population Density (per sq km): The total population density per square kilometer.
Language Minority Determinations
- Armenian - Limited English Proficiency: The percentage of the population age 18 and above who self-identify as speaking English less than "very well" and speak Armenian. This language is designated under California Elections Code (Section 14201) as a Language Minority Determination.
- Cantonese - Limited English Proficiency: The percentage of the population age 18 and above who self-identify as speaking English less than "very well" and speak Cantonese. This language is designated under California Elections Code (Section 14201) as a Language Minority Determination.
- Chinese - Limited English Proficiency: The percentage of the population age 18 and above who self-identify as speaking English less than "very well" and speak Chinese. This language is designated under California Elections Code (Section 14201) as a Language Minority Determination.
- Japanese - Limited English Proficiency: The percentage of the population age 18 and above who self-identify as speaking English less than "very well" and speak Japanese. This language is designated under California Elections Code (Section 14201) as a Language Minority Determination.
- Khmer - Limited English Proficiency: The percentage of the population age 18 and above who self-identify as speaking English less than "very well" and speak Khmer. This language is designated under California Elections Code (Section 14201) as a Language Minority Determination.
- Korean - Limited English Proficiency: The percentage of the population age 18 and above who self-identify as speaking English less than "very well" and speak Korean. This language is designated under California Elections Code (Section 14201) as a Language Minority Determination.
- Mandarin - Limited English Proficiency: The percentage of the population age 18 and above who self-identify as speaking English less than "very well" and speak Mandarin. This language is designated under California Elections Code (Section 14201) as a Language Minority Determination.
- Spanish - Limited English Proficiency: The percentage of the population age 18 and above who self-identify as speaking English less than "very well" and speak Spanish. This language is designated under California Elections Code (Section 14201) as a Language Minority Determination.
- Tagalog - Limited English Proficiency: The percentage of the population age 18 and above who self-identify as speaking English less than "very well" and speak Tagalog. This language is designated under California Elections Code (Section 14201) as a Language Minority Determination.
- Vietnamese - Limited English Proficiency: The percentage of the population age 18 and above who self-identify as speaking English less than "very well" and speak Vietnamese. This language is designated under California Elections Code (Section 14201) as a Language Minority Determination.
Data Downloads